- Turbo Boost page 3 of 6
Now I can rig up air pressure to the actuators, when I apply pressure I can see the actuator arms moving about 2 - 3mm which is not right, they should move only about 0.25mm - 0.5mm !!!
The rear turbo actuator can be accessed once the charge cooler is lifted clear (no need to remove the cc completely), unfortunately the lock nut was seized and I needed to remove the actuator completely to free it up, the front turbo actuator can be accessed from underneath and is easier than the rear turbo......with a pit or lift.
Working to the instructions I wind the arms in to make them shorter a comfortable 2 complete turns. Then go for a drive, at last I can see improved boost to about 1.5bar on the dash boost gauge and the car feels stronger. I leave everything to cool off before checking the actuators and decrease the arm lengths once again. Back out on the road and the boost is even higher, just short of 0.6bar. Again I adjust the arms shorter, but very much on the limit and ensure I get movement on the arm ends using a dial indicator as suggested in the setting instructions. Now I am very confident that the pre-load on the actuators is not less than it should be, perhaps a tiny bit over. I can say that both actuators needed the same amount of adjustment, but the technician who fitted the turbo's must have screwed the setting up.
Ok, so I'm on the right path, but still I don't see 1.7bar absolute.
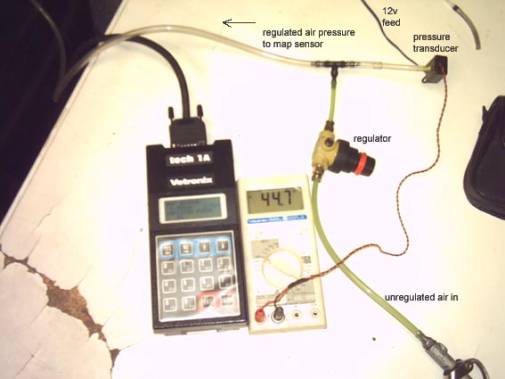
A long shot but, I wanted to confirm that my MAP sensor was telling the truth, due to the fact that my in-car gauge was still not reporting boost levels above 0.6 bar (gauge).
I would have thought a map sensor 13 years old would degrade a small amount……..
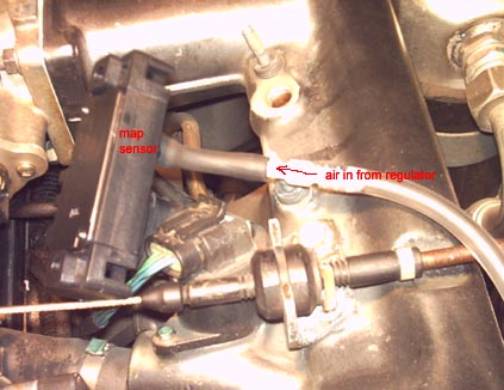
I removed the old MAP sensor from the inlet manifold, leaving the electrical connector plugged in, pushed on the tube end from the regulated air supply onto the sensor pipe.
The other end of the tube was T’eed to the pressure transducer and both then fed regulated air pressure. I was able to read off the results of change in pressure both from the Tech1 and multimeter (after simple conversion) in quite small increments. So, not only was I able to see how the MAP sensor performed (I was looking for a linear rise in MAP pressure) I could check how accurate the readings were again the pressure transducer.
I applied pressure
from nothing to about 1bar (gauge) and noted the results.
|
old |
|
|
|
new |
|
|
|
tech1 bar |
transducer mv |
calc bar |
|
tech1 bar |
transducer mv |
calc bar |
|
1.01 |
0.2 |
1.002267574 |
|
1.02 |
2 |
1.022675737 |
|
1.02 |
0.8 |
1.009070295 |
|
1.05 |
4.5 |
1.051020408 |
|
1.03 |
2.7 |
1.030612245 |
|
1.07 |
6.9 |
1.078231293 |
|
1.05 |
4.9 |
1.055555556 |
|
1.1 |
9.3 |
1.105442177 |
|
1.09 |
7.05 |
1.079931973 |
|
1.13 |
11.7 |
1.132653061 |
|
1.11 |
9.8 |
1.111111111 |
|
1.16 |
14.7 |
1.166666667 |
|
1.14 |
12.8 |
1.145124717 |
|
1.19 |
17.1 |
1.193877551 |
|
1.16 |
14.9 |
1.16893424 |
|
1.2 |
18.3 |
1.207482993 |
|
1.2 |
17.6 |
1.199546485 |
|
1.22 |
19.9 |
1.225623583 |
|
1.23 |
20.7 |
1.234693878 |
|
1.24 |
22.3 |
1.252834467 |
|
1.25 |
22.8 |
1.258503401 |
|
1.27 |
25.2 |
1.285714286 |
|
1.28 |
25 |
1.283446712 |
|
1.3 |
27.3 |
1.30952381 |
|
1.3 |
27.4 |
1.310657596 |
|
1.32 |
29.6 |
1.335600907 |
|
1.33 |
29.7 |
1.336734694 |
|
1.34 |
32.1 |
1.363945578 |
|
1.35 |
32 |
1.362811791 |
|
1.38 |
34.4 |
1.390022676 |
|
1.38 |
34.2 |
1.387755102 |
|
1.41 |
37.1 |
1.420634921 |
|
1.4 |
36.5 |
1.4138322 |
|
1.43 |
39.5 |
1.447845805 |
|
1.43 |
39 |
1.442176871 |
|
1.45 |
42 |
1.476190476 |
|
1.46 |
41.8 |
1.473922902 |
|
1.48 |
44.8 |
1.507936508 |
|
1.48 |
43.8 |
1.496598639 |
|
1.52 |
47.4 |
1.537414966 |
|
1.52 |
46.8 |
1.530612245 |
|
1.55 |
50.3 |
1.570294785 |
|
1.55 |
49.7 |
1.563492063 |
|
1.58 |
53.1 |
1.602040816 |
|
1.58 |
52.3 |
1.592970522 |
|
1.59 |
54.7 |
1.620181406 |
|
1.6 |
54.7 |
1.620181406 |
|
1.63 |
57.6 |
1.653061224 |
|
1.63 |
56.9 |
1.645124717 |
|
1.65 |
60 |
1.680272109 |
|
1.66 |
59.6 |
1.675736961 |
|
1.68 |
62.7 |
1.710884354 |
|
1.69 |
62.3 |
1.706349206 |
|
1.7 |
64.8 |
1.734693878 |
|
1.7 |
64.5 |
1.731292517 |
|
1.73 |
67.3 |
1.763038549 |
|
1.73 |
66.9 |
1.758503401 |
|
1.77 |
70.1 |
1.79478458 |
|
1.77 |
69.9 |
1.792517007 |
|
1.78 |
72.1 |
1.817460317 |
|
1.78 |
71.5 |
1.810657596 |
|
1.81 |
74.3 |
1.842403628 |
|
1.81 |
74 |
1.839002268 |
|
1.83 |
76.5 |
1.867346939 |
|
1.84 |
76.1 |
1.862811791 |
|
1.86 |
78.8 |
1.893424036 |
|
1.86 |
78.6 |
1.891156463 |
|
1.88 |
81.2 |
1.920634921 |
|
1.88 |
80.5 |
1.912698413 |
|
1.91 |
83.4 |
1.945578231 |
|
1.91 |
82.8 |
1.93877551 |
|
1.93 |
85.6 |
1.970521542 |
|
1.93 |
85.1 |
1.964852608 |
|
1.96 |
88.3 |
2.001133787 |
|
1.95 |
87.3 |
1.989795918 |
|
1.98 |
90.2 |
2.022675737 |
|
1.98 |
89.5 |
2.014739229 |
|
2 |
92.3 |
2.046485261 |
|
2.01 |
91.7 |
2.03968254 |
|
2.03 |
94.9 |
2.075963719 |
|
2.02 |
93.6 |
2.06122449 |
|
|
|
|
From the figures it looks like the sensors read very close to each other, but best to plot the results incase there are any peaks within the readings.
The first chart shows that the MAP sensor is recording a nice linear line, and very close to the transducer readings.
The second chart is for the new MAP sensor, this is almost identical to the old sensor
So, there we have what I think is a conclusive result, there is bugger all wrong with the MAP sensor, just what Malcolm predicted
!